Ein schwarzes Diagramm zur Reorientierung der Welt
Das neue Werk an der Rückwand der Kunsthalle Basel wirkt ziemlich mathematisch. Doch anstatt Sachbestände festzunageln, lässt Künstler Nolan Oswald Dennis viele (schwarze) Räume offen. Lässt Gegensätze nebeneinander stehen und schlägt ein Modell vor, welches die Welten zusammenbringt, in "a recurse 4 [3] worlds". von Mirco Kaempf
Nolan Oswald Dennis - a recurse 4 [3] worlds
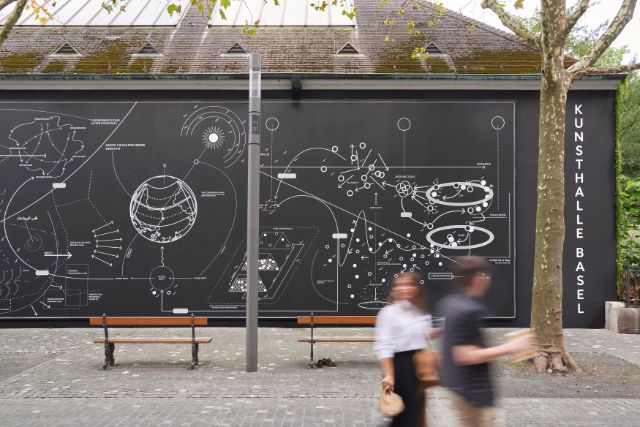
Für das jährliche Aussenwandprojekt der Kunsthalle inszeniert der südafrikanische Künstler ein Diagram-ähnliches Werk mit dem Titel "a recurse 4 [3] worlds"
Das jährlich wechselnde Aussenprojekt zur Bespielung der Rückwand der Kunsthalle Basel zeigt sich die kommenden Monate komplett in schwarzem Hintergrund mit weissen, diagrammähnlichen Beschriftungen. Doch anstatt Dinge fertig zu definieren, ist der Zweck dieses Kunstwerks, zu desorientieren. Es soll Fragen aufwerfen oder, wie es im Englischen so schön heisst, den Prozess des unlearnings voranzutreiben.
Der Künstler Nolan Oswald Dennis, geboren in Sambia und derzeit in Johannesburg lebend, spielt mit der vermeintlichen Unvereinbarkeit zwischen dem dualistischen westlichen Wertesystem, und einem eher holistischen Weltverständnis. Auf 5 x 32 Metern lässt er diese beiden Weltentwürfe in einem Diagramm aufeinander zulaufen. In der Mitte der drei verschiedenen Werkteile, stehten zwei Sahara-Sonnenfinsternisse, vom 29. Mai 1919 sowie die nächste totale Sonnenfinsternis am 2. August 2027. Es sei dies eine Anlehnung dafür, die Welt nicht in Vergangenheit, Gegenwart und Zukunft zu teilen, sondern gesamthaft wahrzunehmen.
![Nolan Oswald Dennis, a recurse 4 [3] worlds, Kunsthalle Basel Rückwand, 2023, Ausstellungsansicht, Foto: Philipp Hänger / Kunsthalle Basel](/.imaging/mte/radiox-theme/small/dam/articles/23-Oktober/Nolan-Oswald-Dennis_KunsthalleBasel_2023_low_08.jpg/jcr:content/Nolan%20Oswald%20Dennis_KunsthalleBasel_2023_low_08.jpg)
When did you start using diagrams in your work and why did you decide, this is the right language for you?
I think I've always in some ways been making diagrams. I think it kind of came out of like an extension of just doodling. I mean, I studied architecture, so that's like the language. And I never felt comfortable with the language until I started using it for other means [...] the thing about diagrams is that they're all - even the most technical diagram - deeply ambiguous. It's the ambiguity that I like.
[...]
the history of diagrammatic thinking predates the kind of scientific rationalist paradigm. Diagrams are deeply spiritual. And maybe there's a kind of tension. I'm really interested in this tension between the coldness, the harsh kind of abstraction of diagrams and the inherent ambiguity. You know, they're open, they're always kind of open. Well, at least for me, that's why they're so attractive and why they get misused or appropriated because they have always this minimum opening. This minimum space that can be filled with something else.
What do you think is the mightiest number in the world?
'Three'
I would've thought you would say 'one' - but why 'three'?
This is maybe going to be a bit complicated, but I think if you think about 'one', you always think about 'two' because one is always two halves. And if you think about 'two', then that's not enough. You always need a third. So 'three' is kind of like the minimum. I guess in like some cosmic sense 'one' is the biggest number and the smallest number. But in my thinking, 'three' is the biggest number and the smallest number.
I guess we don't even know if there's more than one universe, really.
I mean, if there is one universe, then there's definitely half a universe. And if there's half a universe, then there's two universes. And if there's two universes, you need a third one because two is not enough.
Is that a mathematical rule that if there's one, there needs to be two halves?
I don't know if it's a mathematical rule, I mean, this is maybe more a response to dualism and like, binary thinking. Anything, at least in my sense, that imagines one always has like a hidden half. And it's the nature of anything that's whole that it can be separated. But three is always already separated, you know?
![Nolan Oswald Dennis, a recurse 4 [3] worlds, Kunsthalle Basel Rückwand, 2023, Ausstellungsansicht, Foto: Philipp Hänger / Kunsthalle Basel](/.imaging/mte/radiox-theme/small/dam/articles/23-Oktober/Nolan-Oswald-Dennis_KunsthalleBasel_2023_low_01.jpg/jcr:content/Nolan%20Oswald%20Dennis_KunsthalleBasel_2023_low_01.jpg)


.png/jcr:content/magnolia-medium.png)
